Metrics That Matter
This is an overview of 9 financial and non-financial metrics every business owner should be measuring and monitoring.
Hi there, let me ask you a question - do you really understand the state of your business today? If you do that is great but it is quite common for many owners to not really know some of the critical information that tells them what they need to impact or influence important business decisions.
What I want to do in this note is share with you not just what you should be looking at on a very regular basis but why it matters. The list I offer is not exhaustive and includes financial and non financial indicators, metrics and reports. Note also these are not organized by priority or importance but rather by the way I think of them when I discuss them with business owner clients. And a warning – this stuff can be a bit dry bordering on boring but ignore them at your peril!
Let’s get started. The first metric is
New Leads in last week or month. The lifeblood of any business is new customers. Many businesses rely on existing customers for a significant percentage of their revenue but over time you will lose some or all of them so you must always be working to add new customers. Death of a business is having nobody to talk to.
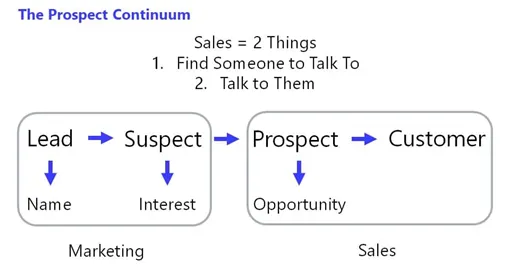
Let me walk you through something I call the Prospect Continuum. My #1 Sales Truth is that sales is really just 2 things namely find someone to talk to and then talk to them. It starts with a Lead which can come from literally dozens of different strategies, tactics and campaigns but that Lead is simply a Name of a person or a business. That is all it is. To turn the lead into a Suspect the Lead must express an interest in what you offer. The Suspect becomes a Prospect when you have identified an actual opportunity. An opportunity is real when you know who the decision maker is, when the buying decision will be made and that there is budget to make the purchase. The last step of the Continuum is when that business or person becomes a customer. To bring it all together it is typically the responsibility of Marketing to generate leads and suspects and the responsibility of Sales to find opportunities and create customers. It does not matter what you sell or how you sell it, this is true every single time. You can do all of this in a couple minute phone call or it can take months in an enterprise environment. What is also true is that you cannot skip a step. Remember what I said a few minutes ago – death of a business or salesperson is having nobody to talk to. So if your business is not generating new leads you really need to do something about it right away and the sooner you know the more quickly you can take action.

In most businesses, marketing is responsible for brand recognition and lead generation. You are probably allocating substantial annual budget to marketing, so you deserve regular reports on how that money is being spent and the results it is generating. For lead generation you should always be looking at 3 or 4 different specific tactical things on the go at any given time. For a typical small business and depending on the stage of the business and monthly revenue you may shift your focus and budget, but you must always be working on this. At one extreme you could be buying radio and TV spots which can be quite expensive even on a local or regional basis. At the other extreme you could be attending business networking events which can be quite inexpensive or doing social media posts which can cost nothing. Regardless of the campaigns you have in place here is what should be common to each of them.
1. They should be as targeted as possible. For this you must have an ideal customer profile.
2. They should have a specific and desired outcome or result that can be tracked and measured. The Call to Action or desired result is not always to buy something. It could be simply to register on your site for updates, brand recognition, to add value on a subject or more but regardless there must be a way to measure those results.
3. They should have a budget that is monitored and tracked. It is amazing how many owners do not even realize how much they are spending on marketing except at a very high level.
Cost per Lead. You should know both how many new leads you get per period and the second metric you should monitor is your cost per lead. I would recommend the maximum period be a month but would prefer you track this on a 4-week rolling basis especially if you are a new business or are trying to grow your business. You should also keep these weekly or monthly numbers on a graphical trend as a quick indicator of how it is changing over time whether for good or bad. If good you can reinforce the success you are having and if bad you can make decisions about what or how to change.
Conversion Rate. On its own the cost per lead does not give you sufficient data to make key decisions on your marketing spend. The third leg of this stool is the conversion rate. If you or your team have the time and resources to track the interim conversion rates like from lead to suspect and suspect to prospect that is great but you must at least track leads to customers because this now tells you the cost of acquisition. Some leads may cost you next to nothing but are so poor they return nothing. At the other extreme you could be paying handsomely for a lead with a very high conversion rate so there is a trade off. As a simple example let’s say you only pay $1.00 per lead on a social media campaigns but you only have a 5% conversion rate. That means for every 100 leads or $100.00 you generate 5 sales. Your cost of acquisition becomes $20.00 per customer. If you are selling a book with a gross profit before advertising of only $10.00 and then you factor in the cost of acquisition you are effectively losing $10.00 per sale. On the other hand, let’s say you have previously had success renting a booth in a show or exhibition. The booth costs you $1000 but over the 3 day event you sell 200 books. Your cost of acquisition per sale is $5.00 and your profit per book is $5.00.
One important thing about conversion rate that is often overlooked is that it can be a very good indicator of your overall sales performance. Regardless of whether you have people directly responsible for converting or closing sales or if you do it all online you can use the conversion or closing rate trend to make critical business decisions. To repeat my #1 sales truth – selling is only 2 things namely find someone to talk to (which is the lead generation piece) and talking to them (which is the selling piece). By simply improving your conversion rates by a few percentage points you can have a dramatic impact on your gross revenue.
A fundamental about marketing and especially when it comes to paid advertising and marketing is that whoever can afford the most will ultimately win big. Now this assumes you have a positive return on your spend. Using the trade show example if you spend $1000 to net $1000 profit what if you could do that 4-6 times a month? What if you could scale up massively by paying others a $2.00 commission per book sale to run booths for you all over the country. In this example, you still pay the $1000 booth fee and another $2.00 per sale but you still net $3.00 per sale or $600 per event. Do this 20-30 times a month and you have a lucrative business and are getting lots of customers.
Customer Value. Notice so far I have only talked about an initial order. Remember your best customer is an existing customer. Once you have the initial order you can upsell, cross sell and more. Given this, one of the other metrics you should track, if you can, is the annual or even lifetime value of a customer. Even if their initial order is typically small to test you and your service and support and logistics you want to know over time how much they spend. If you have this number, you can risk to not make as much or potentially only break even to acquire the customer but again you need to watch this like a hawk to ensure every customer ultimately generates net profits. Oh, and if you really want to have repeat customers you may need to have specific and targeted marketing initiatives to drive this business – something else to think about.
Gross Margin. Oddly enough, many small businesses do not properly calculate gross margin. The correct formula is gross margin is equal to the revenue minus the cost of goods sold divided by the revenue. So if you sell something for $100 that costs you $50 to produce then the GM = (100-50)/100 or 50%. Now here is where this goes wrong for a lot of small business owners. If any labour is included in providing or producing the product or service, it is often not included by the business owner. Many small business accounting packages automatically allocate all labour costs as fixed costs which skews your actual GM. If that $100 product or service includes $50 in parts or products and 30 minutes of labour at $30 an hour your actual Cost of Goods Sold is $50 + $15 or $65 so you actual Gross Margin is now only 35%. On the surface you might think it really does not matter because the numbers all come out in the end but when you are working to increase your Gross Margin or reduce your Fixed costs you absolutely need to understand the direct impact.

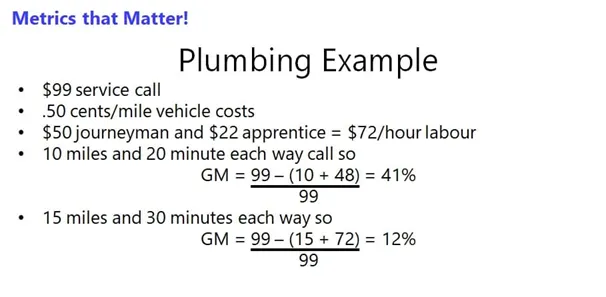
As an example, let’s say you run a plumbing business and you charge $99 for a service call anywhere within a defined distance from your shop or the region you serve. In this case your cost of goods sold or service for just a service call should include the per mile or kilometer cost of the company vehicle which can be at a minimum an annualized average that includes the vehicle lease or loan, the gas and maintenance. It should also include the salary or wages for the plumber and/or apprentice. So your per mile costs to operate the vehicle works out to $.50 a mile and you pay the journeyman $50 an hour and the apprentice $22 an hour. The service call is 10 miles each way and takes 20 minutes each way. So your Cost of goods sold is $10 for the vehicle and $48 for the wages for a total of $58. In this case your GM is 41/99 or 41%. What if the call was 15 miles and 30 minutes each way – for this call the GM would drop to 12/99 or 12%. If all your service calls were the latter at only 12% GM and you then factor in all your fixed costs are you even making a net profit?
Gross profit is the amount of profit made before deducting selling, general and administrative fixed costs. If you have a really low gross profit or margin you really need to a fantastic job of managing all these other costs or you could be in financial peril.
Again, why is this important? Knowing your numbers to a granular layer allows you to make better decisions on pricing your goods or services, how much you pay your employees and much more.
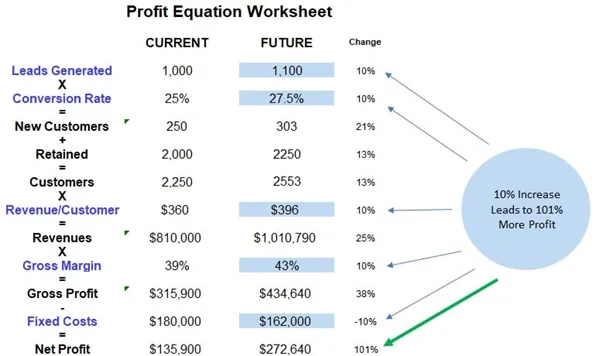
For any business owner, I can demonstrate for you using these metrics from your business and my profit equation review how we can work together to double your net profits in a year or less simply by improving each of those metrics by as little as 10% each. If you would like to learn how to do this in your business, book a 15 minute call with me at www.takeactionresults.com/phonecall for an initial chat about your business.

Now to get a little more technical on the financial side, let’s look 4 other key metrics which offer insight into the financial liquidity of the business.
The first is called the Quick Ratio which is simply your Cash and Receivables divided by your Accounts Payable. There is no right number but rather this is something your want to see on a trend to know on a weekly or monthly basis where you are. You definitely want the number to be above 1 or you risk having what I call a Cash Gap crisis. A lot of small business owners have no idea what their quick ratio is and only realize they have a problem when a bill comes due and they may not have the money to pay it. Worst case is when this affects payroll whether you are a sole proprietor or have many staff.

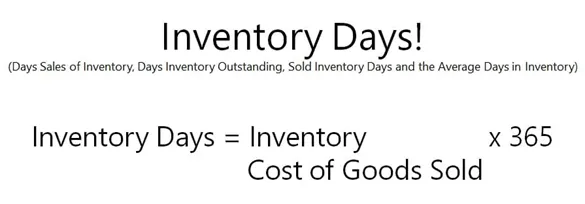
The second is called Inventory Days and can tell you whether you have the right balance of inventory on hand. Just to make things even more confusing this metric is also know as the Days Sales of Inventory or DSI, Days Inventory Outstanding or DIO, Sold Inventory Days and the Average Days in Inventory. Regardless of what it is called it is equal to the total value of the Inventory divided by the Cost of Goods Sold multiplied by 365.
There are two different methods used to determine your Inventory. One is to use the value of inventory at the end of a reporting period which is typically either a Fiscal Year or Quarter. The second method is to use the average of the inventory at the beginning and end of a Fiscal period where you add the two inventory values together and divide by 2.
In general, a lower number is preferred as this suggests you turn you inventory more frequency and have less cash tied up in inventory that is not moving. A high number may indicate you have too much inventory and it can be a real problem if the inventory is old or obsolete. It may also be high if you have purposely stocked up for expected higher sales based on promotions or events. If possible, you want to know how your number compares to your industry and these reports are available and quite illustrative.

The third metric is your Accounts Receivable Days. This will tell you how long it takes to clear your Accounts Receivable and is a measure of the efficiency of your AR process. This is equal to your Accounts Receivables divided by Sales and then multiplied by 365. The Sales number used is your annual Gross Sales Revenue.
There is no such thing as an ideal number. Again, you should be working to ensure your AR days is in line with your industry average. Having said that if your number is 25% or higher than your standard payment terms like net 30 then you should look closely at optimizing your AR process.
The fourth and final metric is your Accounts Payable Days or what is also called the Days Payable Outstanding. This is a financial ratio that indicates the average time it takes a business to pay its bills and invoices to its creditors, suppliers and trade partners. The Accounts Payable Days is equal to your Accounts Payable divided by your Cost of Goods Sold multiplied by 365. As a minimum you should do this quarterly but if you are worried about your financial health you could do this monthly.
The resulting number is a double-edged sword. On one hand a higher number suggests the business has lots of free cash to allow for short term investments or to increase overall working capital. On the other hand, it could indicate a cash flow crunch where some short-term obligations are in arrears creating potential credit risk challenges. As I have indicated multiple times, on its own the number does not really mean a lot but when you compare it to your business industry average you can determine if you are potentially paying too quickly and reducing your free cash or paying too late and having credit issues. Striking a balance is really the best approach to take. To avoid a cash gap problem your Accounts Receivable Days and Accounts Payable Days should be optimized for your business. As a simple example, if your Accounts Receivable Days is 60 and your Accounts Payable Days is 30, you have to finance the 30-day difference between when you pay and when you get paid.

So let’s wrap up. In this note, I have recommended a total of 9 Metrics that Matter. The first five include Leads Generated, Cost per Lead, Conversion Rate, Customer Annual Value and Gross Margin. You can use these metrics to drive good decisions related to your Tactical Marketing Plan and Sales Management System. If you are interested we can use your numbers to do a Profit Equation Review and see what it would take to double your net income in a year or less by incrementally improving these metrics and working on lowering your Fixed costs.
The other four are important financial liquidity indicators and include your Quick Ratio, your Inventory Days, Your Accounts Receivable Days and your Account Payable Days. Although they are more technical, they are easy to calculate and especially if trended and compared to your industry they are very strong indicators that you need to be tracking and acting on. For example, a typical plumbing business will have a Quick Ratio of 2.53, Inventory Days of 17.1, Accounts Receivable Days of 58.24 and Accounts Payable Days of 38.96. Throw in a Gross Margin of 36.1% and a Net Profit of 6.01% and you can quickly determine if you are a residential and light commercial plumbing business how you stack up in your industry.
If you would like to learn how to get the most out of every opportunity in your business to get to the ideal business model needed for long term growth and success, book a short phone call with me to chat. To your Success!
Other Posts
Apprenticeship Plan
Comprehensive Exit Strategy
Crisis Leadership
Delegation Plan
Employee Acquisition Plan
Leadership Continuum
Leadership Development Plan
Mastery Continuum
Metrics That Matter
Organizational Plan
Psychometric Profiling
Sales Continuum
Sales Management Plan
Success Continuum
Tactical Marketing Plan
Time Management Plan
Why A Coach?
© Action Leadership Inc. 2025
All Rights Reserved
624 Cantor Landing SW, Edmonton, T6W 0V6
